If you want to build monitoring for your infrastructure/applications + you want to have proper visualization then you have multiple options. I can see that there is more and more comprehensive tools on the market that allows you to implement end-to-end monitoring for your infra and applications.
Monolith vs Microservices
Now I need to mention that I have been working with different tools including very big monolith software like SCOM (System Center Operations Manager) It is quite powerful solution from Microsoft that is mostly used in On-Prem environments, it is capable to monitor different OS types (Linux/Windows/AIX) and can run custom workloads and scripts written in various languages - powershell, bash, perl etc, additionally there are ready to use Management Packs for some specific solutions like SharePoint for instance. One of the biggest problem with SCOM is it requires powerful servers to handle that workload, also it uses classic relational DB (MSSQL) so it very difficult to scale horizontally, and setup monitoring configuration is not an easy task - you need to know Visual Studio, VSAE - an authoring extension for VS, and not be afraid of large XML files some of them are > 10k lines of code. Also documentation available is very poor, especially for advanced topics like Authoring Management Packs. It’s worth to mention that SCOM solution in cloud will cost you a fortune (large VMs - at least 4vcpu and 16gb RAM for management servers and even larger for DB and DW, MSSQL itself is also quite expensive and you can’t choose different database engine), so for a many customers who decided to move to Cloud using “Lift and Shift” approach is not an option. Even Microsoft that was using SCOM to monitor Azure infrastructure - completely replaced that and built new solution called Azure Monitor, more info here: How Microsoft replaced SCOM with Azure Monitor. With that being said we can conclude that SCOM is fading away for the good. But there are much better solutions that are not only more suitable for Cloud but also much more flexible and efficient, Let’s talk about some of them.
collect, transform, load, visualize
Modern monitoring solutions usually are the combination of several technologies and together they make ‘Monitoring Stack’ for example ELK stack is combination of Elasticsearch, Logstash and Kibana - each of this components serves different purpose. In the stack you might have some sort of data collector to collect performance metrics / logs, you need also database - NoSQL / time-series databases are quite popular for that matter. Last but not least you need piece of software that will Visualize collected data. My favorite stack is: Grafana, InfluxDB, Telegraf. Of course you have the freedom to choose each component separately. For instance instead of Grafana you can choose Chronograf, or instead of Influxdb you can choose Prometheus, it all depends what tool fits best in your case. Almost year ago I have created monitoring of covid-19 pandemic, but never published this to Github so we can use that example to showcase how you can collect, transform, load and visualize data within minutes. This repository contains majority of countries that were tracking covid infections, stats are aggregated daily - we will use that as our source of data. I’m going to use custom collector written in python instead of Telegraf, so our stack will contain:
- Grafana
- InfluxDB
- Python script (with 2 additional modules: requests and Influxdb - official client library)
Dockerfile and docker-compose.yml
All components are running in Docker, for Grafana and Influxdb I’m using official images, for python collector I’m using custom image, here is Dockerfile:
FROM python:3.9.0-alpine
RUN pip install requests Influxdb
WORKDIR /app
COPY collector.py .
ENTRYPOINT [ "python", "collector.py" ]
and here is collector.py:
please note that we are creating additional field currently_infected - because repository that we are using as data source does not include such information, but we can easily calculate it based on existing values
import time
import csv
from datetime import datetime
import requests
from influxdb import InfluxDBClient

INFLUX_CONTAINER = 'influxdb'
DB_NAME = 'covid-19'

def get_data():
    url = 'https://raw.githubusercontent.com/datasets/covid-19/main/data/countries-aggregated.csv'
    r = requests.get(url)
    content = r.content.decode('utf-8').split('\n')
    reader = list(csv.reader(content))
    payload = []
    for line in reader[1:(len(reader) -2)]:
        payload.append({
            'measurement': 'covid19',
            'tags': {
                'date': line[0],
                'country': line[1]
            },
            'fields': {
                'confirmed': int(line[2]),
                'recovered': int(line[3]),
                'deaths': int(line[4]),
                'currently_infected': int(line[2]) - int(line[3]) - int(line[4]),
            },
            'time': int(datetime.strptime(line[0], '%Y-%m-%d').timestamp())
        })

    return payload


if __name__ == '__main__':
    # warmup time for influxdb
    time.sleep(60)
    t = time.time()
    payload = get_data()
    print(f'data generated in: {round((time.time() - t), 2)} seconds')
    t = time.time()
    client = InfluxDBClient(host=INFLUX_CONTAINER, port=8086, database=DB_NAME)
    client.create_database('covid-19')
    client.write_points(payload, time_precision='s')
    print(f'data inserted in: {round((time.time() - t), 2)} seconds')
all services configured together in docker-compose.yml:
version: "3.5"

services:
  influxdb:
    image: influxdb:1.8.4
    container_name: influxdb
    volumes:
      - ./influxdb/influx_data:/var/lib/influxdb
    ports:
      - "8086:8086"
    networks:
      - monitoring
    restart: unless-stopped

  grafana:
    image: grafana/grafana:latest
    container_name: grafana
    user: $UID
    volumes:
      - ./grafana/grafana_data:/var/lib/grafana
      - ./grafana/provisioning:/etc/grafana/provisioning
    ports:
      - "3000:3000"
    networks:
      - monitoring
    restart: unless-stopped

  collector:
    build: ./collector
    container_name: collector
    stdin_open: true
    tty: true
    networks:
      - monitoring
    depends_on:
      - grafana


networks:
  monitoring:
    name: monitoring
Let’s run the stack!
I’m running this stack in my Raspberry Pi 4 which is not as powerful as a beefy servers in your datacenter, but it is fast enough to do the job. As I’m writing this post our datasource CSV file contains more than 92000 lines, let’s see how fast we can download, transform and load it into InfluxDB.

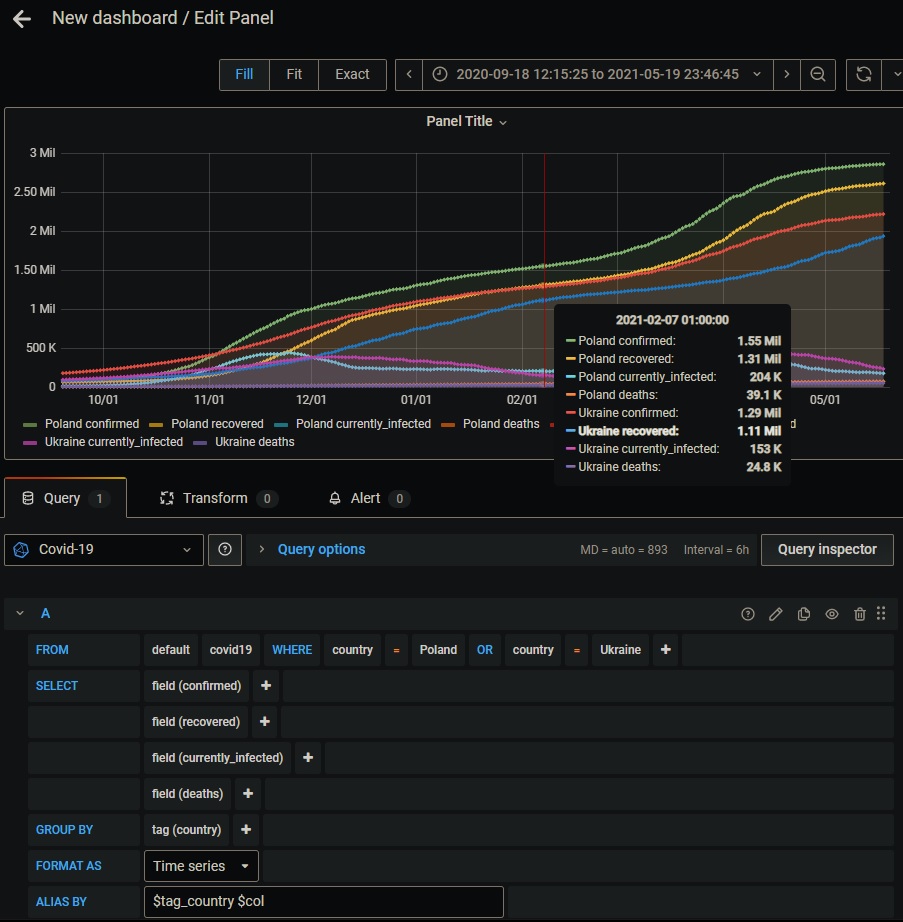
as you can see it took around 16 seconds in total to download, transform and load data, not bad if you consider that it all happened in tiny raspberry pi board. Finally if you open Grafana you will be able to create new dashboard based on covid metrics. I just did the one below in less than 2 minutes:

That’s it, I hope you find this post interesting, this is repository that contain all the configuration files and scripts: https://github.com/Krzysi3k/covid19-metrics so you can play with it.


